Kallakurichi

District Profile

Demographic - Census 2011

Total Population: 3458873
Density : 481 per sq.km
Female : 195860
Male: 208246
Elderly : xxxxx
Literates: 2195776 (63%)
Urban Population: 519088 (15%)

Livelihood - Census 2011

Total Main Workers: 1260802
Marginal workers : 442447
Non workers : 1755624
Eco-sensitive aspects: TN wetland Mission
Total wetland area : xxxxx ha
Ramsar sites: xxxxx
Area 7194 sq.km , No. of Blocks 17 , No. of Villages 412 , Municipalities 1 , Panchayat Unions: 9 ,Town Panchayats 6

Kallakurichi

Land Use / Land Cover

Water Resources
Major River Basin: Pennaiyar and Vellar

Pennaiyar River Basin - 46.35%
         
Vellar River Basin
53.65%
Major river: Komukhi, Manimutharu, Gedilam and Thenpennaiyar
Water Systems : 2 dams and 760 tanks
(IWS & PWD, 2017)
Agriculture
Net area sown: 148635ha ha

Cropping intensity - 1144.5 %
         
(Agriculture statistics, 2021)
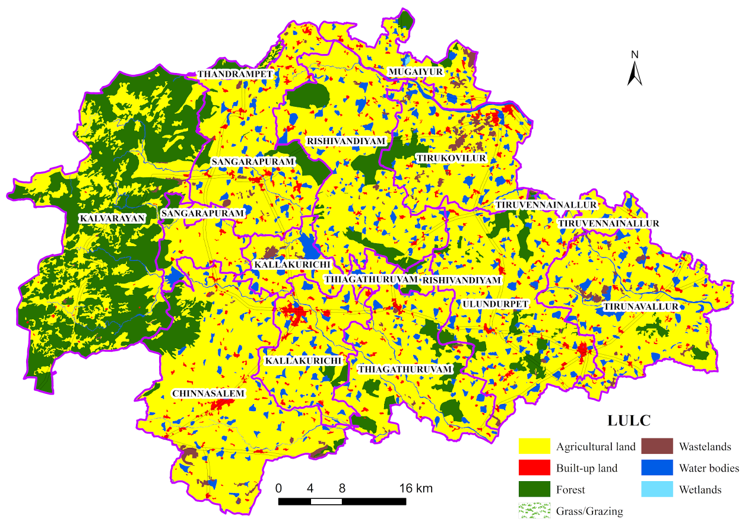
Forests
Moderately Dense Forest: 235.70 sq.km
Very Dense Forest: 78.64 sq.km
(FSI 2021)

         
Sustainable Habitat:
Built up area : 117.4 sq.km (NRSC, 2015)
(District Statistical Handbook, 2021-2022)

Kallakurichi

Temperature Profile

Observed Temperature Trend (1951-2020)

Annual average Maximum Temperature : 33.0 oC
Annual average Minimum Temperature : 23.1 oC
Temperature Projections with reference to baseline:
(1985-2014)

Kallakurichi

Rainfall Profile

Observed Rainfall Trend (1951-2020)

Annual average Rainfall : 1013.4 mm
Rainfall Projections with reference to baseline (1985-2014)

© 2023 Centre for Climate Change and Disater Management, Anna University, All Rights Reserved.
Designed by Ahamed Ibrahim and Asan Basheer, CCCDM