KANYAKUMARI

District Profile

Demographic - Census 2011

Total Population: xxxxx
Density : xxxxx per sq.km
Female : xxxxx
Male: xxxxx
Elderly : xxxxx
Literates: xxxxx (xxxx%)
Urban Population: xxxxx (xxxx%)

Livelihood - Census 2011

Total Main Workers: xxxxx
Marginal workers : xxxxx
Non workers : xxxxx
Eco-sensitive aspects: TN wetland Mission
Total wetland area : xxxxx ha
Ramsar sites: xxxxx
Area xxxx sq.km , No. of Blocks xxxx , No. of Villages xxxx , Corporation xxxx , Municipalities xxxx , Panchayat Unions: xxxx , Town Panchayats xxxx

KANYAKUMARI

Land Use / Land Cover

Water Resources
Major River Basin: Kodayar and Nambiyar

Kodaiyar River Basin - xxxx%
         
Nambiyar River Basin
xxxx%
Major river: Thambaraparani (Kuzhithuraiar)
Water Systems : 9 dams and 2422 tanks
(IWS & PWD, 2017)
Agriculture
Net area sown: 73481 ha

Cropping intensity - xxxx %
         
(Agriculture statistics, 2021)
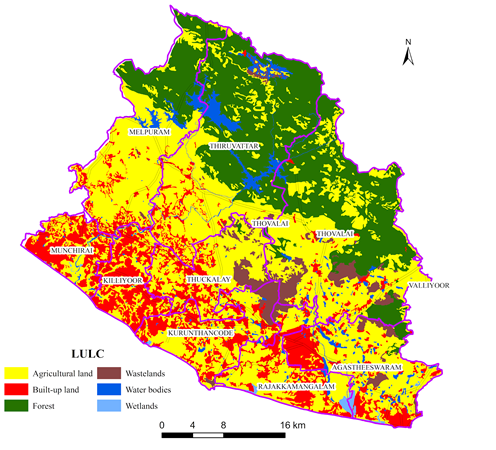
Forests
Moderately Dense Forest: xxxx sq.km
Very Dense Forest: xxxx sq.km
(FSI 2021)

         
Coastal
Length of the coast: xxxx km
(District Statistical Handbook, 2021-2022)

         
Sustainable Habitat:
Built up area : xxxx sq.km (NRSC, 2015)
Nagercoil Corporation area : xxxx sq.km
(District Statistical Handbook, 2021-2022)

KANYAKUMARI

Temperature Profile

Observed Temperature Trend (1951-2020)

Annual average Maximum Temperature : xxxx oC
Annual average Minimum Temperature : xxxx oC
Temperature Projections with reference to baseline:
(1985-2014)

KANYAKUMARI

Rainfall Profile

Observed Rainfall Trend (1951-2020)

Annual average Rainfall : xxxx mm
Rainfall Projections with reference to baseline (1985-2014)

© 2023 Centre for Climate Change and Disater Management, Anna University, All Rights Reserved.
Designed by Ahamed Ibrahim and Asan Basheer, CCCDM